


An Aggressive Growth Pharmaceutical Stock
Posted by Crista Huff on Jul 6, 2013 in Buy Now!, Free Stock Market Content, Growth Stocks | 0 comments
(Note: This article was reserved for Goodfellow LLC subscribers until January 28, 2017, when I made it available to the general public.)
We last wrote a full research report on Valeant Pharmaceuticals International (VRX, $88.77) in January 2013. When the stock peaked on May 28, we ceased our buy recommendation on the stock. The price is currently up 39% since our January recommendation.
The stock shot upwards in late May, then formed a cup-and-handle chart pattern, which is bullish for a near-term breakout. Now that the stock price has consolidated, we are resuming our buy recommendation on Valeant shares, and would buy at any near-term price in anticipation of a breakout over $92.
* * * * *
Valeant Pharmaceuticals International Inc. is Canada’s largest specialty drugmaker. Product categories include dermatology, neurology and opthalmology; featuring Solodyn oral anti-acne therapy, Wellbutrin, and Restylane dermal filler. Corporate growth is derived both from increasing product sales, and mergers & acquisitions.
In May, the company announced an agreement to purchase privately-held eye-care company Bausch & Lomb Holdings Inc. for $8.7 billion, putting the company in dominant positions in the fields of both opthalmology and dermatology. The deal will be financed by the issuance of new equity and debt.
Valeant’s long-term debt ratio is high, at 56%. The company’s CEO has expressed an interest in a “merger of equals” in order to build the company and reduce leverage.
Wall Street projects earnings per share (EPS) to grow 34%, 42%, and 18% in fiscal years* 2013 through 2015, a significant increase in growth from expectations back in January 2013.
Earnings growth is coming from a higher-margin product mix, rapidly increasing sales, and cost synergies related to acquisitions, offset in part by merger-related financing costs.
The VRX 2013 price-earnings ratio (PE) is 14.7. The PE has ranged from 5 to 26 during the company’s last six profitable years.
S&P has a Qualitative Risk Assessment of “High” on VRX stock. “Our risk assessment primarily reflects risks associated with the challenges of integrating acquisitions, achieving planned synergies and growing the overall business. Along with other branded pharmaceutical companies, VRX also faces R&D risks associated with the development, regulatory approval and commercialization of pipeline products.”
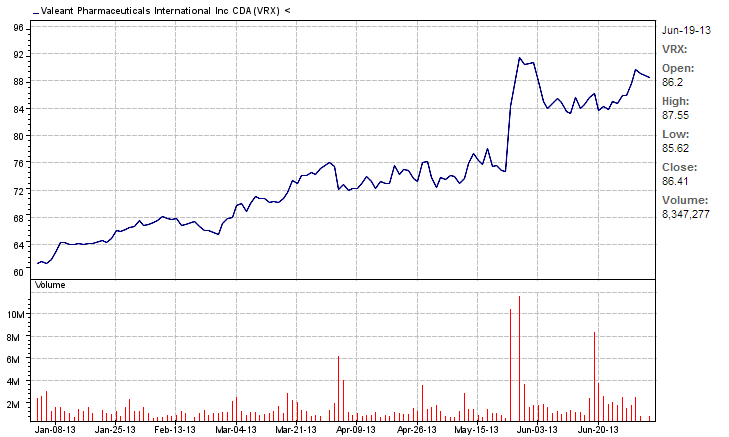
Valeant Pharmaceuticals
year-to-date chart
07-05-13
We still believe that the company’s high debt levels, and the volatile nature of the stock price, warrant investor caution. This is a stock for experienced aggressive growth investors, who should use stop-loss orders to protect profits.
The stock is trading between $82 and $92, with secondary support at $76. I expect the VRX price to rise in the near-term, based on a bullish cup-and-handle chart pattern.
* Valeant operates on a December fiscal year.
Crista Huff
President
Goodfellow LLC
* * * * *
Investment Disclaimer
Release of Liability: Through use of this website viewing or using you agree to hold www.GoodfellowLLC.com and its employees harmless and to completely release www.GoodfellowLLC.com and its employees from any and all liability due to any and all loss (monetary or otherwise), damage (monetary or otherwise), or injury (monetary or otherwise) that you may incur.
Goodfellow LLC and its employees are not paid by third parties to promote nor disparage any investment. Recommendations are based on hypothetical situations of what we would do, not advice on what you should do.
Neither Goodfellow LLC nor its employees are licensed investment advisors, tax advisors, nor attorneys. Consult with a licensed investment advisor and a tax advisor to determine the suitability of any investment.
The information provided herein is obtained from sources believed to be reliable but is not guaranteed as to accuracy or completeness. When information is provided herein from third parties — such as financial news outlets, financial websites, investment firms, or any other source of financial information – the reliability or completeness of such financial information cannot be guaranteed.
The information contained on this website is provided for informational purposes only and contains no investment advice or recommendations to buy or sell any specific securities. This is not an offer or solicitation for any particular trading strategy, or confirmation of any transaction. Statements made on the website are based on the authors’ opinions and based on information available at the time this page was published. The creators are not liable for any errors, omissions or misstatements. Any performance data quoted represents past performance and past performance is not a guarantee of future results. Investments always have a degree of risk, including the potential risk of the loss of the investor’s entire principal. There is no guarantee against any loss.

Leave a Reply