


How To Keep China From Harming Your Stock Market Performance
by Crista Huff, September 8, 2015
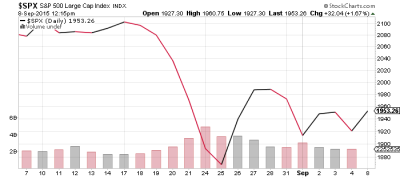
S&P 500 index (SPX) one-month chart 09-08-15
The major U.S. stock market indices — the S&P 500, the Dow, and the NASDAQ — each fell almost exactly 14% from recent summertime highs to August lows, culminating in a rapid spike downward on August 21st, 24th, and 25th. Each index promptly rebounded, then stabilized in a classic double-bounce chart pattern.
It’s important to understand several things about this stock market correction:
-
Markets do not quickly rebound from 14% price corrections: they need to stabilize before they can recover. And you can see in the one-month chart of the S&P 500 (above, right) that stocks began stabilizing immediately after the late-August price correction, affectionately known as the flash crash.
-
Stock market activity cannot be perceived as worrisome or chaotic when all three indices fall the same percentage, and all three have exactly the same recent chart pattern in the weeks after the initial price correction. Chaos is not organized; and therefore, identical movements within these three indices cannot be construed as chaotic.
-
The August stock market correction was not a market crash. And to remind you what a crash looks like, kindly take a look at the nine-year chart of the S&P 500 (below, right). The S&P lost over half its value, over the course of a year and half in 2007-2009. Look at the chart! Do you see the huge price drop on the bottom left side of the chart? Do you see the tiny little price correction on the top right? Do you understand that what just happened in U.S. stock markets is nothing compared to a stock market crash??
Sign up to receive my free stock-investing newsletter! —>>
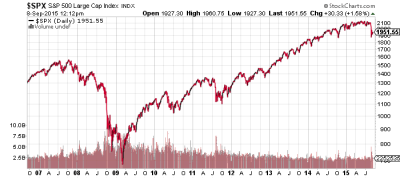
S&P 500 index (SPX) nine-year chart 09-08-15
What I am asking you, therefore, is to stop worrying.
The NASDAQ is showing the most strength this year, of the three aforementioned indices. During the August correction, the index bounced down to price support that was established last winter. The S&P 500, which has had a lackluster year, bounced down to price support that was solidly established in 2014.
The Dow Jones Industrial Average has been the weakest of the three indices this year, largely due to falling commodity prices, and economic problems in China and emerging markets. The Dow bounced down to price support that was established in the second half of 2013, through the first quarter of 2014.
I was not worried about the August market correction, because U.S. stock markets were neither overvalued nor overextended. Those situations would have been cause for serious concern. (For a brief tutorial on that topic, please read How Do I Know If We’re Due For A Stock Market Downturn?.) Therefore, I began publishing buy low opportunities on August 24th, and many times thereafter.
All three 2015 Goodfellow LLC model portfolios are beating the markets!
While it is normal that a large country’s economic upheaval will affect U.S. markets, the fact is that only certain sectors of the U.S. stock market will actually be harmed by China’s economic slowdown, and the ensuing devaluation of the yuan.
Here’s how to reposition your stock and mutual fund portfolios, to avoid much of the trouble that’s being caused by China. First, the short answer: search for companies that are well-positioned with little-to-no exposure to emerging markets, China, or currencies.
China is in a long-term economic slowdown. This means that they’re using less energy and related commodities: oil, gas, chemicals, and metals. Thus, stocks of commodity producers are suffering: a lower demand for a product causes that product’s price to fall.
You should do your best to avoid owning energy- and commodity-related stocks right now. I know that you might want to go bottom-fishing in these industries, but it’s going to be a long time before these stocks recover, considering that oil prices have not yet stabilized.
Subscribe now, and begin improving your investment portfolio returns today!
Oil stocks hold additional risk because each company will need to decide whether to cut its dividend, in order to shore up its balance sheet. That’s how much the companies are being harmed by the severe drop in oil prices. If you depend upon energy stocks for dividend income to pay your monthly bills, you need to be prepared for the possibility that some of those stocks will cut their dividends during the coming year. You can compensate by reallocating cash into these dividend-paying growth stocks:
-
a fertilizer company with a 3.5% dividend
-
a financial company with a 2.3% dividend and a several-billion-dollar share repurchase authorization
-
a communication infrastructure company with a 2.1% dividend
-
a retail company with a 3.45% dividend
-
a cement company with a 2.4% dividend
-
a travel & leisure company with a 2.4% dividend
Multi-national companies are additionally being harmed by the devaluation of the yuan. When China made its currency weaker, several emerging market countries followed suit. Therefore, it just became more expensive for those countries’ citizens to purchase American products. The net effect is that American companies that sell their products in those countries will now sell fewer of their products, and almost certainly with lower profit margins, than they had previously expected to sell. This future drop in revenue and profit is directly affecting stock prices today.
The strong U.S. dollar was already hammering multi-national companies’ profit margins this year, and that situation just became worse. That’s why the Dow has been suffering this year. Of all the major U.S. stock market indices, the Dow has the highest concentration of commodity stocks, and stocks of companies that sell products to China and emerging markets.
If you own and manage a stock portfolio, or a stock mutual fund portfolio, you can dramatically improve your near-term performance by concentrating on companies that do business in America; and avoiding commodity producers and multi-national companies. For mutual fund investors, my suggestion is to reallocate your equity funds away from very large-cap, Dow-oriented mutual funds — and of course, away from energy sector funds — and into S&P 500, NASDAQ, mid-cap, and small-cap stock mutual funds; always keeping an eye on your personal risk tolerance.
Eight of the ten 2012-2014 Goodfellow LLC model portfolios
outperformed the market averages by margins of 50-100% and more!
I have not had any trouble foreseeing these problems, nor avoiding these problems, in my model equity portfolios. There have been no energy stocks in my 2014 or 2015 model portfolios; and only one metal producer — which has, of course, been my worst performer. Despite the trouble in global equity markets this summer, all three of the 2015 Goodfellow LLC model equity portfolios have consistently outperformed the U.S. stock market indices, often by wide margins.
You are welcome to subscribe to my stock market website, Goodfellow LLC, for better stock portfolio guidance. I don’t sell investment products, and I don’t handle your stock transactions. I simply write well-informed articles about stocks, to help you decide exactly which stocks to own, in order to improve your stock portfolio performance, always with an eye toward minimizing risk.
There’s lots more I can say about China, emerging markets, bonds, and interest rates, etc. I’ll write more about those topics in the coming weeks. Please feel free to shoot me your questions to research@goodfellowllc.com.
Happy investing!
Crista Huff
President
Goodfellow LLC
* * * * *
Investment Disclaimer
Release of Liability: Through use of this website viewing or using you agree to hold www.GoodfellowLLC.com and its employees harmless and to completely release www.GoodfellowLLC.com and its employees from any and all liability due to any and all loss (monetary or otherwise), damage (monetary or otherwise), or injury (monetary or otherwise) that you may incur.
Goodfellow LLC and its employees are not paid by third parties to promote nor disparage any investment. Recommendations are based on hypothetical situations of what we would do, not advice on what you should do.
Neither Goodfellow LLC nor its employees are licensed investment advisors, tax advisors, nor attorneys. Consult with a licensed investment advisor and a tax advisor to determine the suitability of any investment.
The information provided herein is obtained from sources believed to be reliable but is not guaranteed as to accuracy or completeness. When information is provided herein from third parties — such as financial news outlets, financial websites, investment firms, or any other source of financial information – the reliability or completeness of such financial information cannot be guaranteed.
The information contained on this website is provided for informational purposes only and contains no investment advice or recommendations to buy or sell any specific securities. This is not an offer or solicitation for any particular trading strategy, or confirmation of any transaction. Statements made on the website are based on the authors’ opinions and based on information available at the time this page was published. The creators are not liable for any errors, omissions or misstatements. Any performance data quoted represents past performance and past performance is not a guarantee of future results. Investments always have a degree of risk, including the potential risk of the loss of the investor’s entire principal. There is no guarantee against any loss.

Leave a Reply