


How To Optimize Your Stock Portfolio Performance During Difficult Years
U.S. stock markets continue to trade sideways, with volatility, since the huge market recovery in October. The S&P 500 rose 8.3% in October! That’s an astonishing one-month return for a large group of stocks! Experienced investors know that a run-up to that degree is unsustainable, and that the market will need to have a pullback, and stabilize, before being ready for its next upward move.
Now we’re having the pullback. Good! That means we’re closer to seeing the S&P stabilize. I realize that all this volatility is unnerving, but from a chartist’s point of view, there’s a method to the madness.
Falling oil & commodity prices are a big influence on U.S. stock market indexes in 2015, because the indexes have a significant number of stocks in those sectors. Naturally, a drop in energy-related stock prices will pull the indexes downward.
(article continued, below chart…)
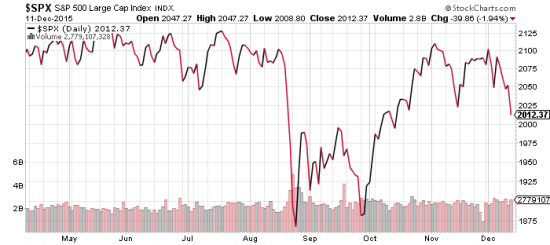
S&P 500 Index (SPX) eight-month chart 12-12-15
Charts courtesy of StockCharts.com.
The problem is, as investors see those indexes fall, some of them panic. Their panic is anchored in emotion, and unrealistic expectations. The S&P 500 is only down 2.26% year-to-date, through Dec. 11th! Can their mutual fund performance be far behind? Yet they panic and sell their mutual funds, causing good stocks with strong earnings growth to fall, alongside weak stocks with falling earnings.
This is a stock market designed for patient investors, and buy low opportunists. It’s also a really good time to make some portfolio adjustments, because the prices of good stocks are down, alongside the prices of poor stocks. You can switch from one to the other, while knowing that you’re getting a bargain price on your new purchase.
If you’re frustrated with your stock portfolio performance, likely caused by energy-related stocks, here’s my suggestion. Prune one or more stocks from your portfolio, and replace them with growth stocks.
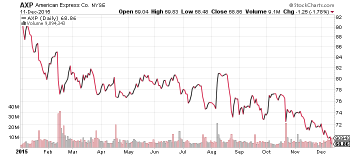 1. Identify your worst stocks by looking at their earnings and charts.
If the stock chart appears similar to the chart on the right — falling! — the stock is not going up any time soon. This stock has not finished falling yet, and it’s been falling for a long time. Any stock that’s fallen for a long time will have to stabilize for quite a while — several months, minimum — before beginning its recovery.
Next, look at the stock’s projected earnings per share (EPS) for 2015, ’16 and ’17. If those numbers do not reflect annual increases, or worse, they point to falling EPS, then there’s logically no reason for institutional investors to buy those stocks. Always remember that institutional investors move the markets! Ignore whatever your cousin or co-worker is buying or selling, and focus on the methodical portfolio management process of professionals. Professionals want to buy stocks in companies with rising EPS, because those are the stocks which are most likely to rise, while maintaining good valuations!
By selling at least one problem stock in your portfolio, you will have less stress, because you will be taking action toward solving your portfolio problem.
2. Find some attractive stocks that are expected to have double-digit earnings growth in the coming years. After all, stock performance is really all about earnings growth. So you want to quickly screen out companies that are expected to have stagnant or falling earnings.
In reality, you should have a list of such stocks at-the-ready, so that if you find yourself with cash to invest, or one of those stocks presents a buying opportunity, you’re ready to take action.
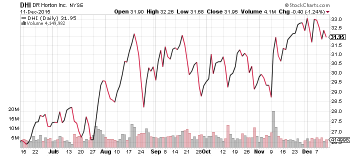
3. Now that you have a list of attractive stocks, look for those that have really stable trading ranges. For instance, in the chart on the right, this stock traded sideways for 3.5 months before continuing its upward climb.
Once you identify a clear trading range, it’s easy to buy low within that trading range.
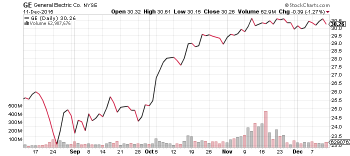
Another very productive chart pattern is one wherein the stock price trades in a somewhat flat line for a few weeks. The stock in this chart maintained its strength, despite lots of concurrent stock market volatility. The next near-term move, on a stock that has this pattern, is generally upward.
If the company has strong projected earnings growth for the next two years, an undervalued price/earnings ratio (PE), and the share price has stabilized, go for it! You might have to wait a while before the stock begins to climb, but you will know that you’ve purchased a bargain.
Amidst this month’s market volatility, I’m going to skip publishing Monday’s Buy List for the coming week. Instead, I’ll simply publish my usual commentary on news & price changes on Goodfellow LLC recommended stocks.
Subscribe now, and begin improving your investment portfolio returns today!
Send questions and comments to research@goodfellowllc.com.
Happy investing!
Crista Huff
President
Goodfellow LLC
Chief Analyst
Smart Investing in Turbulent Times
* * * * *
Investment Disclaimer
Release of Liability: Through use of this website viewing or using you agree to hold www.GoodfellowLLC.com and its employees harmless and to completely release www.GoodfellowLLC.com and its employees from any and all liability due to any and all loss (monetary or otherwise), damage (monetary or otherwise), or injury (monetary or otherwise) that you may incur.
Goodfellow LLC and its employees are not paid by third parties to promote nor disparage any investment. Recommendations are based on hypothetical situations of what we would do, not advice on what you should do.
Neither Goodfellow LLC nor its employees are licensed investment advisors, tax advisors, nor attorneys. Consult with a licensed investment advisor and a tax advisor to determine the suitability of any investment.
The information provided herein is obtained from sources believed to be reliable but is not guaranteed as to accuracy or completeness. When information is provided herein from third parties — such as financial news outlets, financial websites, investment firms, or any other source of financial information – the reliability or completeness of such financial information cannot be guaranteed.
The information contained on this website is provided for informational purposes only and contains no investment advice or recommendations to buy or sell any specific securities. This is not an offer or solicitation for any particular trading strategy, or confirmation of any transaction. Statements made on the website are based on the authors’ opinions and based on information available at the time this page was published. The creators are not liable for any errors, omissions or misstatements. Any performance data quoted represents past performance and past performance is not a guarantee of future results. Investments always have a degree of risk, including the potential risk of the loss of the investor’s entire principal. There is no guarantee against any loss.

Leave a Reply